
Home > Service > Class support > ScombZ > Display of survey tables and graphs
Display of survey tables and graphs
2020/11/11 更新
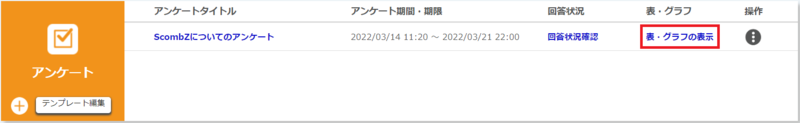
Click the [View] link under "Tables and Graphs" of the questionnaire on the "Edit Subject TOP" screen to display the results of the questionnaire in a table or graph.
※ Users whose provisional registration has expired and who have not yet registered for classes are not included in the results.
Only teachers can display clicker (normal and simple) results in real time.
After the start date of the results release, the results can be displayed on the student's results confirmation screen.
In order to display the results, you must set [Survey Results Public] to Public on the Edit Survey screen.
The format of the table displayed will follow the content specified when creating the survey questions.
The result display screens for the Normal Survey, Clicker (Normal), and Clicker (Simple) are different from each other.
- Normal survey results display
- Clicker (normal) result display
※ In the results display period, the results will be displayed in the same way as for a regular survey. - Clicker (simple) result display
※ In the results display period, the results will be displayed in the same way as for a regular survey.


